Struggling to get employees back to the office?
Want to boost company culture and employee engagement?
Does your field service staff miss the mark while on site?
At BDC Software, we faced these same challenges. Here’s how we solved them with an innovative approach to time tracking.
This a simple story of how we created a fun and competitive company culture back in our BDC Software days. It starts after we begin more-than-doubling our company size for several years in a row. With an influx of new employees, onboarding into our culture is a primary concern for retention in an industry where the average turnover rate is over 57%. Our goal is to beat the average significantly and create relationships among all the employees to make BDC an outstanding place to work.
Many of our hires are young and eager to compete. We identified a few simple metrics we cared most about:
- Ratio of time spent on client projects versus other things (e.g., training and self-development).
- Number of check-ins into our source control repository.
- Hours spent per project (Kanban flow metrics)
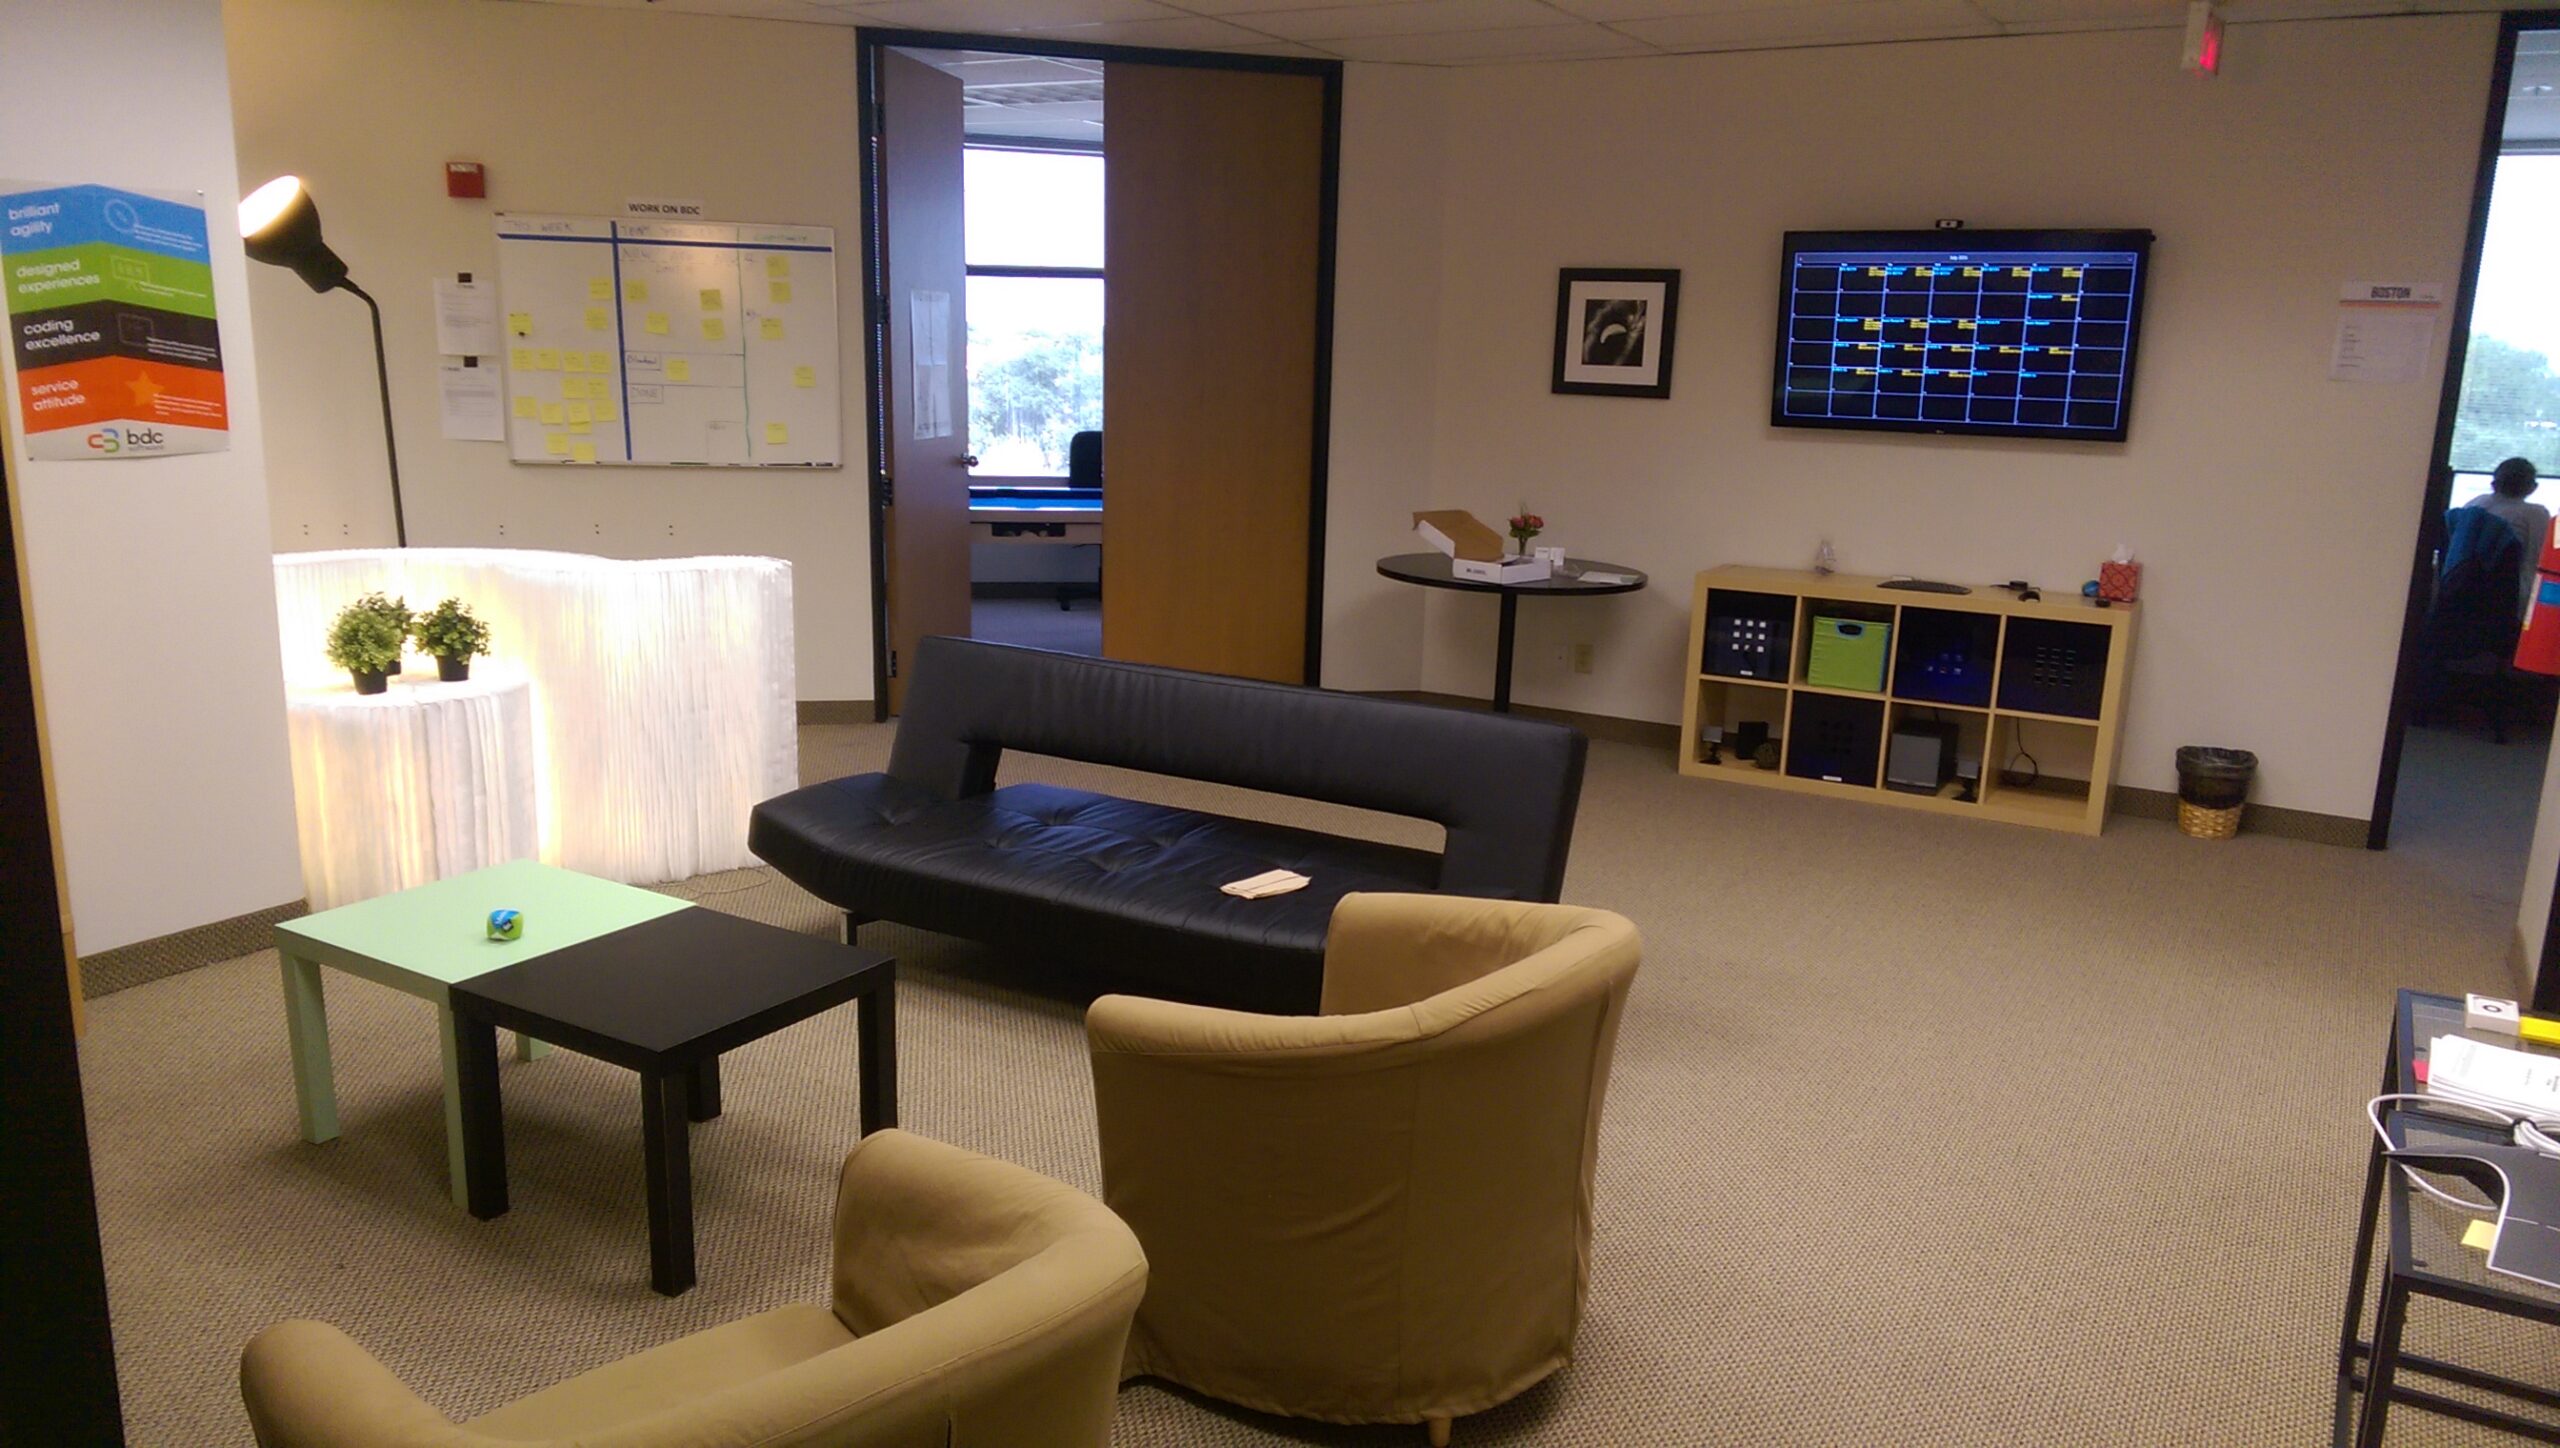
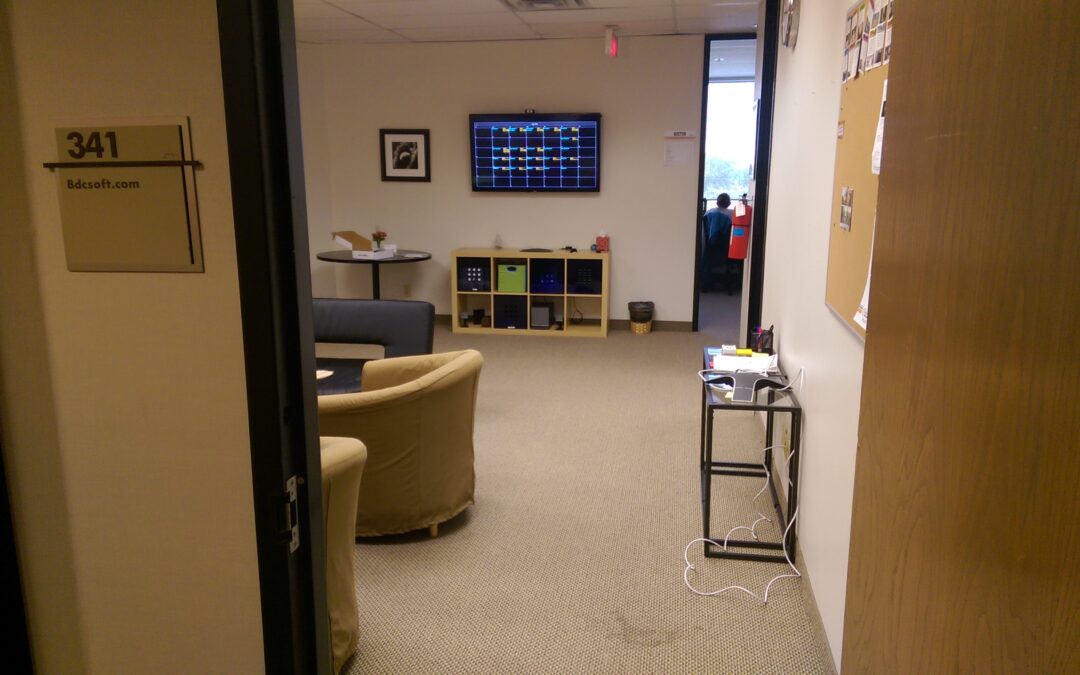
Some of this data is contained in our Easy2Time project and time tracking tool. And some of it comes from our source code repository. Using our ETL (extract-transform-load) software and integration expertise, we combined the data and organized it by Worker. Then we created a simple data visualization which was maintained in real-time and placed in the center of our office space, visible also from the office entry. Yes, that means visiting clients and anyone else can see who is performing and who is behind.
It looked like this:

“Our real-time performance display drove friendly competition and a culture of accountability”
The result: The type of culture our people wanted to show up for. The type of culture that creates friends for life, even outside the office. Those that moved on still keep in contact even many years later.
Lessons learned:
- We should have done this sooner.
- People tend to “filter” things they see which are static and do not change often enough visually. So we began rotating the display to include other announcements, calendars, etc.
- We could have just changed the color scheme behind the metrics data and people would think it was “different”.
What do you need to make this work and transform your employee engagement?
Step 1: Define key metrics you want to gamify.
Step 2: Get a project / time tracking tool which can export data.
Step 3: Pull data from a CRM or ERP system – whatever you defined from step 1.
Step 4: Install a wall-mounted TV or digital signage display in a common area of the office.
Step 5: Connect a tiny computer to the TV, to run the visualization app.
Step 6: Build the data visualization app with AI or low/no-code tools, or ask a software developer to build one.
Ready to boost engagement by 50% and cut turnover in half? Schedule a demo of Easy2Time to see how gamified time tracking can transform your team’s performance and culture.

